Your Error Rate Is Zero. Your AI Pipeline Is Broken.
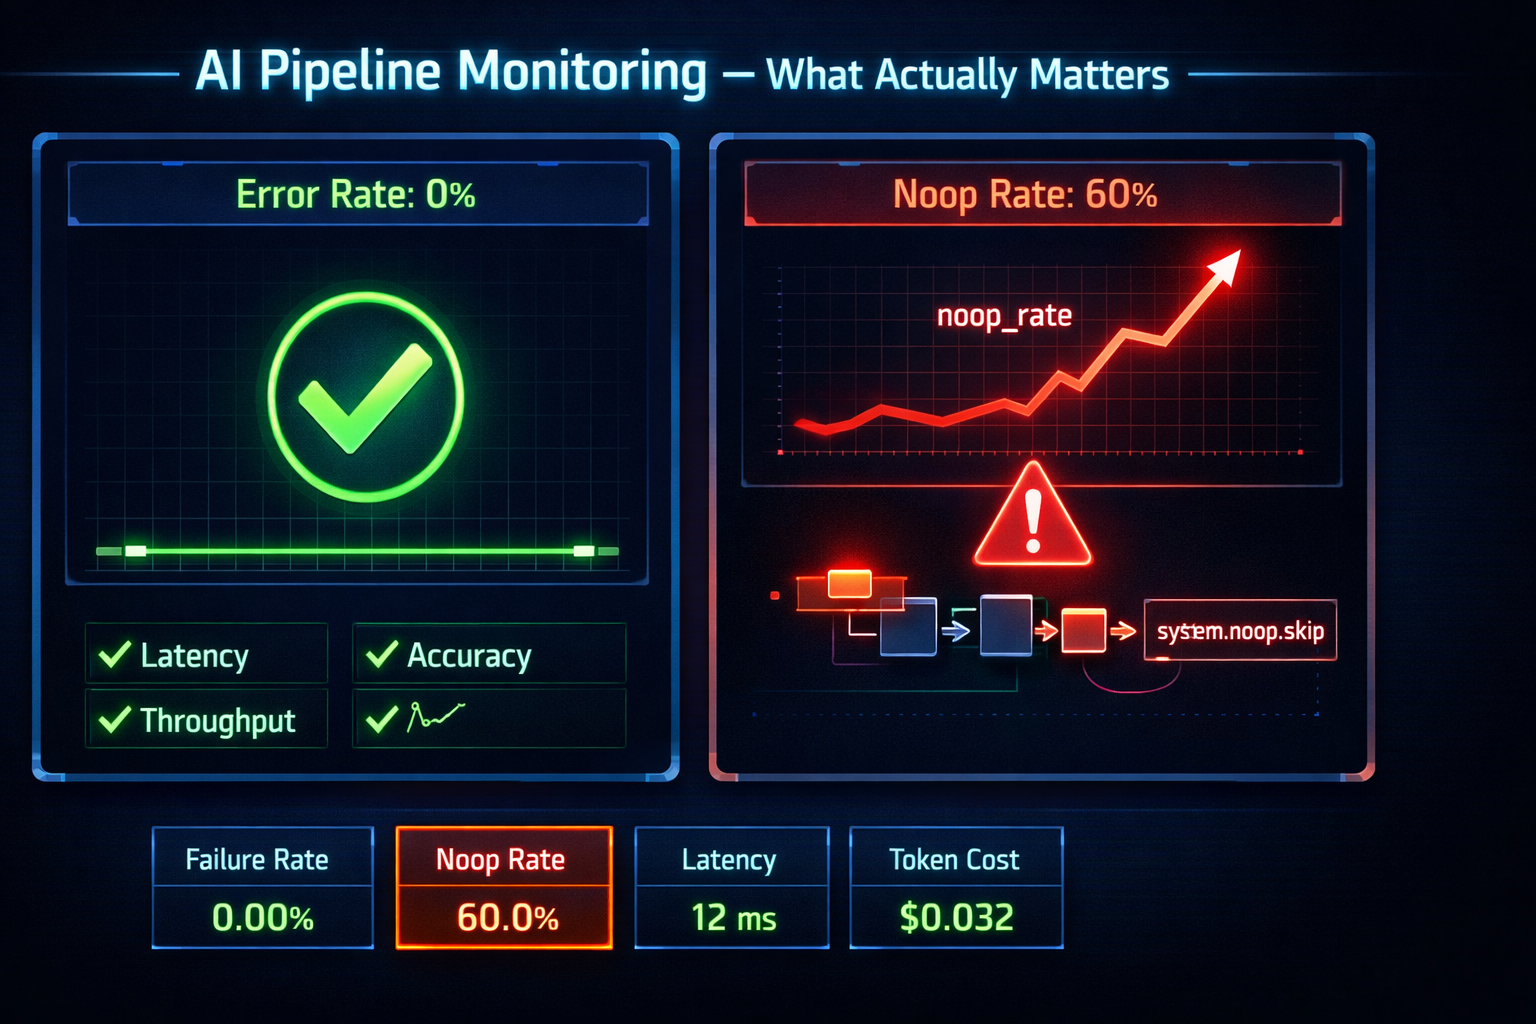
Your error rate is 0%. Uptime is 100%. P95 latency looks fine.
Meanwhile, your agent has been returning system.noop.skip on 60% of inbound messages since you deployed that prompt change two days ago. Real requests are silently dropped. No exception was raised. No alert fired.
This is the monitoring gap in AI pipelines. And your existing dashboards can't see it.
Two Types of Failure
In a traditional service, failure is binary: the function throws or it doesn't. You monitor the throw.
In an AI pipeline, there are two failure modes — and only one of them throws:
Technical failure. The LLM API returned a 500. The request timed out. The input was too large. These surface as exceptions, update status: "failed", and fire an agent_run.failed webhook. Your existing monitoring catches this. It's the easy case.
Behavioral failure. The agent completed successfully — status: "completed" — but the output is wrong. It classified a refund request as a noop. It extracted the wrong booking reference. It routed a room service request to the support agent. No exception was raised. No error was logged. The webhook fired with a clean payload. Your backend processed it. The wrong thing happened.
Behavioral failures are invisible to error rate dashboards. You need different metrics to see them.
The Four Metrics That Matter
1. Failure rate
The floor. If status: "failed" climbs, something broke at the infrastructure layer.
SELECT
  date_trunc('hour', created_at) AS hour,
  count(*) FILTER (WHERE status = 'failed') AS failures,
  count(*) AS total,
  round(100.0 * count(*) FILTER (WHERE status = 'failed') / nullif(count(*) FILTER (WHERE status IN ('completed', 'failed')), 0), 1) AS failure_pct
FROM agent_runs
WHERE created_at > now() - interval '24 hours'
GROUP BY 1
ORDER BY 1;
Failure subtypes matter: QuotaExceeded means you need to upgrade your plan. InputTooLarge means something is sending runaway context. AI::Error means your provider is having issues. Don't just count failures — read the error_message.
2. Noop rate
The signal most teams never track. And the most important one.
Every agent run either produces a business action or returns system.noop.skip. The noop rate is the fraction of completed runs that took no action:
SELECT
  date_trunc('hour', created_at) AS hour,
  count(*) FILTER (
    WHERE status = 'completed'
    AND output->'actions' @> '[{"type":"system.noop.skip"}]'
  ) AS noops,
  count(*) FILTER (WHERE status = 'completed') AS completed,
  round(100.0 * count(*) FILTER (
    WHERE status = 'completed'
    AND output->'actions' @> '[{"type":"system.noop.skip"}]'
  ) / nullif(count(*) FILTER (WHERE status = 'completed'), 0), 1) AS noop_pct
FROM agent_runs
WHERE created_at > now() - interval '24 hours'
GROUP BY 1
ORDER BY 1;
A stable noop rate is expected — not every WhatsApp message needs an action. "Thanks!", "👍", "ok" are all legitimate noops. In our experience, a well-configured agent settles between 15–30% noop on typical WhatsApp traffic — but this varies heavily by domain.
What you're watching for is a spike. Noop rate jumps from 20% to 65% overnight? Three possible causes:
- A prompt change made the agent too conservative
- The input distribution changed (a new channel sending different message types)
- The model was quietly updated by the provider
None of these throw an exception. All of them destroy the value of your pipeline.
3. Latency
Not for performance — for anomaly detection.
latency_ms tracks the LLM call itself. duration_ms tracks the full run including overhead. Both are stored per run.
Stable latency is a health signal. A sudden spike in latency_ms without a corresponding spike in input_tokens means the model is under load — or the provider changed something. A gradual drift upward means your context is growing: more conversation history, larger system prompts, accumulated fields.
The useful alert isn't "p95 > 3s" — it's "latency this hour is 2x the baseline from the same time yesterday." Relative thresholds beat absolute ones because the baseline shifts when you change models or prompts.
4. Token cost
Every run logs input_tokens and output_tokens. Aggregate them daily:
SELECT
  date_trunc('day', created_at) AS day,
  model_used,
  sum(input_tokens) AS total_input,
  sum(output_tokens) AS total_output,
  sum(input_tokens + output_tokens) AS total_tokens
FROM agent_runs
WHERE created_at > now() - interval '7 days'
GROUP BY 1, 2
ORDER BY 1, 2;
Token tracking serves two purposes. The obvious one: cost visibility. But the less obvious one is more valuable: token count is a proxy for context size.
input_tokens blowing up — doubling over a week with no change in message volume — means your context is accumulating garbage. Old conversation summaries that aren't being pruned. System prompts that grew without anyone noticing. A message type that's injecting unusually long payloads.
Catching a 2x token growth early costs you nothing. Catching it after a month of runaway spend is painful.
The Threshold Pattern
The failure modes above are all detectable in real time. You don't need to wait for a user to report a problem — you can alert before they notice.
The pattern: define thresholds at 80%, 90%, and 100% of any quota or behavioral limit. Fire three distinct signals:
- 80% — informational. Something is trending. Look at it.
- 90% — warning. Take action before the end of the period.
- 100% — critical. The limit is hit. Sending is paused.
QUOTA_THRESHOLDS = [80, 90, 100].freeze

def check_quota_thresholds
  pct = (count * 100.0 / limit).floor

  QUOTA_THRESHOLDS.each do |threshold|
    next if pct < threshold
    next if already_alerted?(threshold)  # deduplicate within the same period

    fire_alert(threshold)    # in-app notification
    fire_webhook(threshold)  # quota.warning or quota.exceeded
    fire_email(threshold)    # email to account owner
  end
end
Three channels, one alert per threshold per period. The deduplication key matters: without it, every message after you hit 80% fires the same alert.
The same structure works for behavioral signals. For noop rate, define a baseline window (last 7 days, same hour of day) and alert when the current hour exceeds 2x that baseline:
baseline = avg_noop_rate(last: 7.days, hour: Time.current.hour)
current  = noop_rate(last: 1.hour)

fire_noop_alert if current > baseline * 2
No absolute threshold needed — just relative degradation against your own history.
Feedback as Ground Truth
There's one signal that none of the above can replicate: human feedback.
Every agent run can receive a feedback value — positive or negative — from the person reviewing the output. This is the only metric that comes from reality rather than inference.
A negative feedback rate of 5% is more informative than any technical metric. It means one in twenty runs produced an output a human rejected. That's the number you want to trend downward.
The practical constraint: feedback requires a human in the loop. For high-volume pipelines, you can't review every run. What you can do:
- Sample 5% of runs for manual review
- Auto-flag runs with low confidence scores for review
- Make it trivially easy to submit feedback from the webhook consumer (a thumbs-up/down next to each action in your internal tool)
Feedback doesn't replace the other metrics — it validates them. If your noop rate looks stable but negative feedback is climbing, the agent is taking the right volume of actions — but getting them wrong. Wrong action type, wrong fields, wrong interpretation. The metrics say everything is fine. The humans say it isn't. Reality wins.
What to Ignore
Some things teams instrument that don't actually help:
Uptime. Your LLM provider has their own status page. You don't need to replicate it. status: "failed" with error_message: "AI::Error" is sufficient.
Per-run token counts. Individual run token counts are too granular to act on. Track aggregates (daily, by model, by agent). The outliers matter only when they're statistically significant.
Raw throughput. "We processed 10,000 runs today" is a vanity metric. What matters is the distribution across statuses and noop rate at that volume.
Response quality per run. Reviewing every completed run for quality doesn't scale. Use sampling, feedback, and the eval suite (see: Unit Tests Don't Work on AI) for systematic quality tracking.
The Monitoring Stack
Distilled to a checklist:
Track:
  ✓ Failure rate — by type (quota, concurrency, AI error)
  ✓ Noop rate — rolling 1h and 24h windows
  ✓ Latency — relative to baseline, not absolute
  ✓ Token cost — daily aggregates by model

Alert at:
  ✓ 80% / 90% / 100% of any quota
  ✓ Noop rate > 2x baseline for 1h
  ✓ Failure rate > 5% for 15min

Validate with:
  ✓ Feedback (positive / negative) on sampled runs
  ✓ Eval suite on every prompt change
Your error rate being zero means nothing. Your noop rate trending toward 50% means your pipeline is quietly failing your users. That's the number to watch.
WhatsRB Cloud logs tokens, latency, and status on every agent run — accessible via the dashboard and the API. Feedback can be submitted per run using the SDK or the API. Full reference: Agent Runs documentation.